Ever taken a trade that looked perfect on the 15-minute chart, only to watch it get steamrolled a few minutes later? You're not alone. It happens to almost every trader at some point, and it usually comes down to one thing: you were looking at a tiny slice of the market without checking what the bigger picture was doing.
That's exactly the problem the multi-timeframe strategy is designed to fix.
What Is Multi-Timeframe Trading, Really?
At its core, multi-timeframe analysis means looking at the same currency pair across two or three different chart timeframes before deciding whether — and how — to enter a trade. Instead of relying on a single window into price action, you zoom out to see the trend, then zoom in to time your entry.
Think of it like planning a road trip. You wouldn't just stare at a street-level map to decide which highway to take — you'd check the regional map first to see the overall direction, then use the street map to navigate the last few blocks. Trading works the same way. The higher timeframe tells you where the market wants to go. The lower timeframe tells you when to jump in.
The Three-Tier Framework
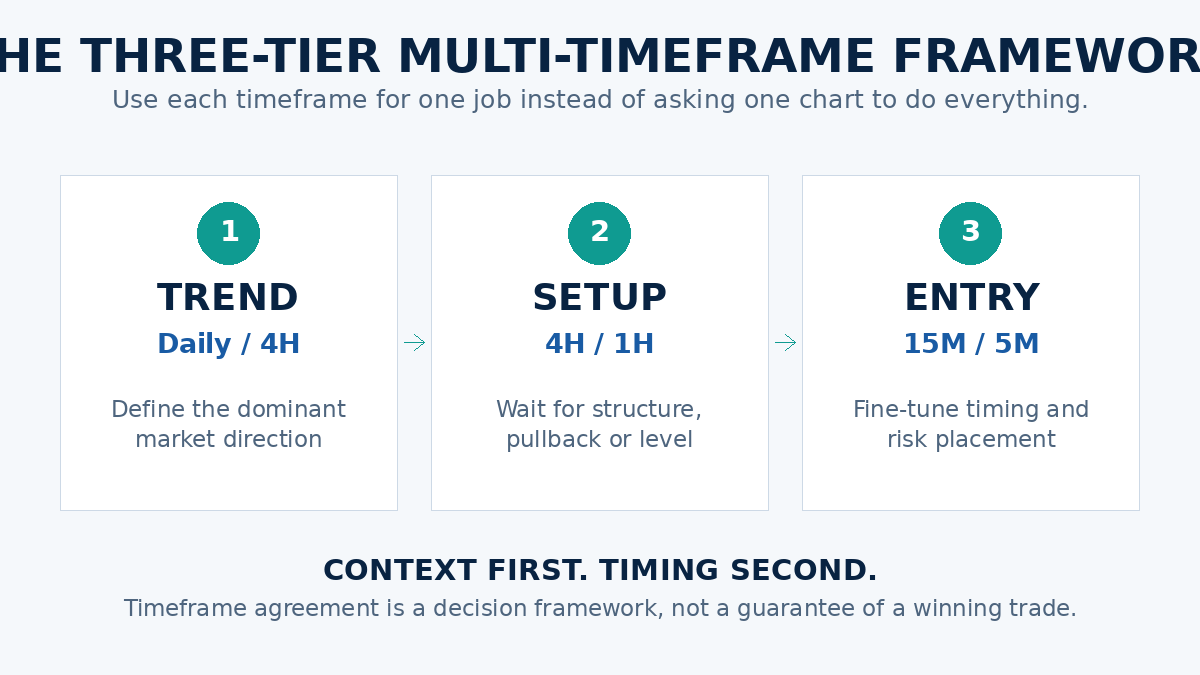
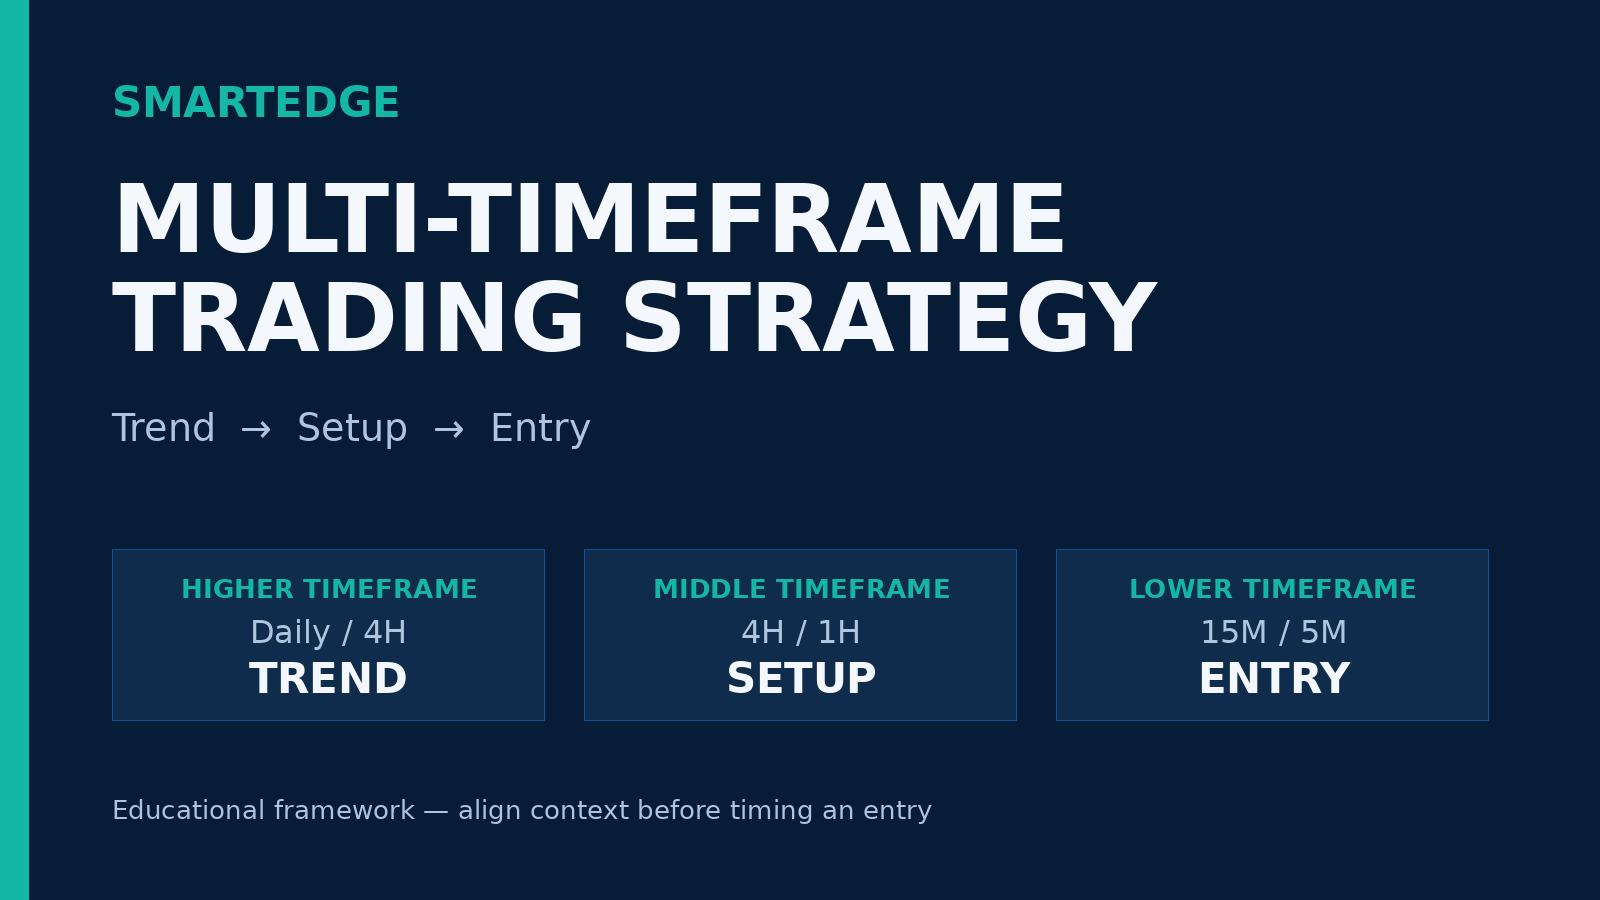
Most experienced traders build their multi-timeframe approach around three levels:
1. The Trend Timeframe (the "map")
This is your big-picture view — typically the daily or 4-hour chart. Its only job is to tell you the dominant direction of the market. Is price making higher highs and higher lows (uptrend)? Lower highs and lower lows (downtrend)? Or just chopping sideways? This timeframe answers one question: which direction should I even be looking to trade?
2. The Setup Timeframe (the "neighborhood")
This is usually one step down — say, the 1-hour chart if your trend timeframe is the 4-hour. Here, you're looking for a specific pattern that supports the direction from step one: a pullback to a moving average, a break of a minor structure, a bounce off support or resistance. This is where your actual trade idea starts forming.
3. The Entry Timeframe (the "street")
This is your fine-tuning tool — often the 15-minute or 5-minute chart. Once your setup timeframe gives you a valid pattern, you drop down here to time your entry precisely, tighten your stop loss, and improve your risk-to-reward ratio.
The magic isn't in any single timeframe — it's in the agreement between them. When your 4-hour chart says "uptrend," your 1-hour chart shows a clean pullback to support, and your 15-minute chart gives you a bullish reversal candle, you've got what traders call confluence. That's when probabilities start tilting in your favor.
Why This Actually Works
Here's the honest truth: no strategy gives you certainty in forex. What multi-timeframe analysis gives you is context. Without it, you're essentially trading blind — reacting to whatever candle just printed on your screen, with no idea whether you're fighting the tide or swimming with it.
Traders who skip this step often fall into a predictable trap: they take a short trade on a 5-minute chart because "it looks bearish," completely unaware that the daily chart is in a strong uptrend and that dip is just noise before the next leg up. Multi-timeframe analysis forces you to ask the right question before you ask the wrong one.
A Simple Example
Let's say you're watching EUR/USD.
On the daily chart, price has been making a series of higher lows for the past three weeks — clearly bullish.
You drop to the 4-hour chart and notice price has pulled back to a well-tested support zone, with the 50-period moving average sitting right there too.
You then check the 1-hour chart and see a bullish engulfing candle forming right at that zone, with RSI turning up from oversold territory.
That's three timeframes telling you the same story. You're not guessing — you're stacking evidence.
Common Mistakes to Avoid
Even good traders mess this up. A few things to watch for:
- Timeframe overload. Checking five or six charts before every trade leads to analysis paralysis, not clarity. Stick to three, maximum four.
- Ignoring the higher timeframe when the lower one looks exciting. The lower timeframe will always look more dramatic — that's just how zoomed-in charts work. Discipline means letting the higher timeframe have the final say on direction.
- Forcing trades when timeframes disagree. If your daily chart is bullish but your 1-hour chart is choppy and directionless, the right move is often to wait, not force an entry.
- Forgetting risk management. Multi-timeframe analysis improves your odds — it doesn't replace a stop loss or a sane position size.
Building It Into Your Routine
The real value of this strategy comes from consistency, not from using it once on a lucky trade. Before you open any chart, get in the habit of asking three questions in order:
- What is the higher timeframe trend telling me?
- Is there a valid setup forming on my middle timeframe that agrees with that trend?
- Can I time a clean, low-risk entry on my lower timeframe?
If you can't answer "yes" to all three, that's not a trade — that's a guess with extra steps.
Final Thoughts
Multi-timeframe trading isn't flashy, and it won't make you rich overnight. But it does something more valuable: it turns trading from a reactive guessing game into a structured decision-making process. You stop asking "does this look good right now?" and start asking "does this fit the bigger story the market is already telling me?"
Master that shift, and you'll find yourself taking fewer trades — but far better ones.